Reading Between Credentials
What IPEDS data might tell us if we ask different questions.
Companies usually decide whether to move forward with a candidate based on credentials: degrees, institution names, job titles, or years of experience. These proxies persist because it’s difficult to assess someone’s ability to do the job quickly. That’s why degrees and university names remain the default filter, especially for early-career roles and positions with lots of applicants. They feel trustworthy and can be verified, and much like hiring consultants, they diffuse responsibility by outsourcing the evaluation of talent to an external authority. In this case, the institution.But relying on credentials too heavily assumes that individuals’ abilities can be measured with a level of precision that doesn’t exist. More accurate alternatives are often avoided because of cost and time constraints. [1]
New tools are emerging to improve this. Skills inference software, like Textkernel, compares metadata about competencies (pulled from job histories or course titles) to the requirements of a role. These are promising but due to data constraints, aren’t yet reliable replacements. [2]
Traditionally, credentials have been used to infer hard skills. But there’s no consistent way to translate between the two so we lean on assumptions about what a degree means and what different institutions signal to form an impression about what individuals can do. This helps explain why employers are often surprised when new hires are not work-ready on day one. [3] The skills gap is, in part, due to this misalignment: employers, credentials, and candidates aren’t speaking the same language.
Employers often claim to value knowledge, but their behaviour suggests otherwise. Ask what a top university signals and you’ll hear “critical thinking,” “intellect,” or “work ethic.” Rarely does anyone specify what a graduate from that institution can actually do better than someone from a less selective school or a bootcamp. If knowledge were truly the priority, you’d hope they’d be more bullish about the details. Instead, hiring decisions lean in the direction of perceived traits, not subject mastery.
Resume audit studies support this. Candidates from elite universities receive more interview callbacks than equally qualified applicants from less prestigious schools. [c] In sectors like finance and consulting, institutional prestige carries more weight than the subject studied.[d] What’s being evaluated isn't just what someone knows, but how they’re presumed to operate.
Economist Bryan Caplan popularised the idea of the “sheepskin effect”: degrees serve as signals of cognitive and behaviural traits like IQ and conscientiousness more than actual knowledge. [e] Test scores (used in admissions) reflect cognitive ability while graduation signals follow-through. This helps explain why someone who completes seven out of eight semesters may earn significantly less than someone who finishes all eight. The jump in earnings comes from holding the credential, not the knowledge acquired per semester. This underscores that a degree functions as shorthand for perceived traits, with its value tied to completion. [4]
Using credentials to infer traits isn’t inherently problematic. It makes sense that employers want to hire intelligent, conscientious people. These are valuable traits in many workplaces. Given the limited data available about candidates, credentials feel like a safe evaluation tool. But the issue arises when employers aren’t explicit, even to themselves, about what they’re actually hiring for. A credential may stand in for a loosely defined sense of “someone good” without clarity on which traits matter for success in the specific role. Being more explicit about the traits that matter would open the door to more targeted and inclusive ways of identifying candidates who possess them.
For instance, employers don’t strictly hire someone with an economics degree for their financial modelling or Excel fluency. They hire because the degree signals someone who can learn quickly and figure things out. In practice, the specifics of internal systems aren’t taught in the classroom anyway. At firms like Goldman Sachs, for example, even tools like Excel are customised. New hires will need training either way. What matters is the ability to adapt skills to different contexts. And once that ability becomes associated with an institution, the subject studied matters less than the university name.
This only becomes a problem when we pretend we’re hiring for knowledge and expect credentials to carry that weight. Separating trait signals from skill demonstrations can allow for more precise evaluation.
Traditional hiring practices have their place. For large companies, hiring from the same set of schools creates predictability. It helps standardise onboarding, streamline communication, and set expectations around the capabilities new hires arrive with. But as a consequence, these methods narrow the talent pool and concentrate competition around a small group of graduates.
This approach also overlooks the reasons students choose where to study. Cost, family obligations, location and flexibility shape these decisions–factors that have little to do with ability or potential. At the same time, rankings like U.S. News reinforce narrow definitions of quality by focusing on metrics like faculty salaries, alumni giving, and acceptance rates. [f] Reading them this way doesn’t make much sense. They often reflect how a college operates as a business more than how its graduates perform in the workforce.
Taken together, these realities highlight the limitations of using institutional vanity metrics as a proxy for ability. For students choosing where to enrol and employers deciding who to hire, such rankings offer little practical insight.
One way companies could broaden their talent pipelines without sacrificing cultural cohesion is by hiring from overlooked schools. Strong culture comes from a shared mindset, regardless of its particular character. Each school has its own culture which isn’t necessarily stronger or weaker than others. A company can build just as much cohesion by tapping into a different, aligned talent pool with less competition and allowing its culture to evolve around those institutions.
While this isn’t a sourcing guide, understanding what traits different credentials signal can help companies build more intentional and inclusive pipelines. By reinterpreting the information they contain, my hope is to inspire a bit more creativity in how we understand the people who’ve earned them.
By structuring this framework in a familiar list format, the goal is to subvert expectations. Not to rank schools, but to reinterpret what institutional signals might tell us about behaviour.
Using IPEDS Data to Infer Traits
Once companies clarify the traits they’re hiring for, the next question is how to identify those traits using available data.
That’s where datasets like IPEDS (Integrated Postsecondary Education Data System) come in. (This is the same dataset the US News and most other rankings use to generate rankings.) Consider a school with high test score admits and a low four-year graduation rate. [5] If a student graduates on time from that environment, they’re likely both capable and organised. The academic bar was higher and institutional support may have been weaker. That combination can be a strong individual signal. In contrast, high graduation rates may reflect strong institutional support. A signal could be inferred by considering both the context and the outcome.
Another group worth highlighting is transfer students. Transferring often means navigating bureaucracy, interpreting unclear policies, thinking across systems and advocating for yourself. A student who does this and graduates has demonstrated adaptability and follow-through. Not all transfers are equally complex, but the behaviours they often require can be useful in the workplace.
These behaviours reveal sought after traits. While institutional data can’t identify individuals, it can help locate environments where they are more likely to have had to exercise desirable traits to succeed.
This isn’t about discarding credentials. It’s about reading them differently. Instead of treating them as proof of knowledge, which they aren’t particularly good at, we can interpret them in ways that surface how someone adapts under pressure or executes across systems.
The groupings below are not rankings, but reflections of distinct behavioural traits that are likely to have emerged from how students navigated their institutional context. Each list highlights colleges where, based on environmental conditions, a higher proportion of graduates are likely to have demonstrated a given trait. These are illustrative groupings (not evaluations of institutional quality or prestige) that serve as examples of environments where students may have had to exercise specific traits to succeed.
The signals are derived from institutional data such as graduation patterns, enrolment types, and transfer behaviour, and interpreted as proxies for cognitive and behavioural qualities that employers value.
Conscientiousness
Conscientiousness reflects a student’s ability to plan, stay organised, and follow through. It’s signalled by timely graduation (particularly for Pell recipients who may face additional friction) and is adjusted for institutional support. Higher scores suggest more graduates likely demonstrated strong execution habits in challenging environments.
- Princeton University
- Massachusetts Institute of Technology
- Yale University
- University of Chicago
- Duke University
- University of Pennsylvania
- Cornell University
- Georgetown University
- Washington and Lee University
- Brown University
Resilience / Grit
Resilience is inferred from persistence over time. Signals include steady progress toward graduation despite delays (e.g. 6 or 8-year completion), as well as patterns common among transfer students, older learners, and military-connected students. These students may not follow a linear path but they finish anyway.
- Boricua College
- Capella University
- National University
- DeVry University (California and Georgia campus)
- Everglades University
- Eastern Kentucky University
- Strayer University, Virginia
- Embry-Riddle Aeronautical University
- Columbia Southern University
- Hallmark University
Adaptability
Students who navigate multiple modes of learning, like hybrid or online coursework, or who transfer from other institutions, are likely more adaptable. The method considers older learners and military-connected students who often balance education with life responsibilities, such as work or childcare. This suggests the ability to manage competing priorities in various contexts.
- Saint Elizabeth University
- Palm Beach Atlantic University
- Los Angeles Pacific University
- Susquehanna University
- Wilmington University
- Wright State University, Lake Campus
- Barton College
- College of the Ozarks
- University of Maine at Fort Kent
- University of Central Oklahoma
Self-Direction
Self-directed learners tend to pursue nontraditional paths that require agency. This trait is inferred from enrolment patterns such as part-time status, undergraduates over the age of 25, or hybrid learning paired with completion. These individuals are more likely to be self-managing and intentional about their educational journey.
- Eastern Kentucky University
- Hallmark University
- Otis College of Art and Design
- Fresno Pacific University
- University of Southern California
- D’Youville University
- Ave Maria University
- Virginia Union University
- Everglades University
- University of Baltimore
Growth Mindset
Growth mindset reflects a belief in development over time. It’s captured by students who persist across multiple learning formats and continue progressing despite slow starts. Extended but steady graduation timelines indicate that students may have built capabilities iteratively rather than arriving with them fully formed.
- Bethune-Cookman University
- D’Youville University
- Virginia Union University
- Otis College of Art and Design
- Ave Maria University
- Norfolk State University
- Texas College
- Jarvis Christian University
- Wiley University
- Art Center College of Design
Cognitive Readiness
This reflects mental preparedness for complex reasoning and problem-solving, adjusted for context. High scores on standardised assessments (when available), weighted against the percentage of Pell recipients, suggest students had both cognitive ability and the readiness to apply it under varied conditions.
- Massachusetts Institute of Technology
- Georgetown University
- Georgia Institute of Technology
- United States Merchant Marine Academy
- University of Florida
- Florida Polytechnic University
- Purdue University
- Duke University
- University of Georgia
- The University of Tennessee, Knoxville
Communication
This is inferred from English (SAT and ACT) assessment scores, on-time graduation (4 years for non-Pell, 6 years for Pell), and a school’s proportion of international students. Communication here is not just about verbal skill, but about navigating academic systems and succeeding across language or cultural contexts. The resulting score is adjusted for higher populations of non-U.S. students at private colleges.
- Georgetown University
- Massachusetts Institute of Technology
- University of Florida
- United States Merchant Marine Academy
- Duke University
- Georgia Institute of Technology
- University of Chicago
- Yale University
- Bryn Mawr College
- Brown University
Quantitative Reasoning
This is based on math-related test scores (SAT and ACT). It captures analytical skill and numeracy, which are important for roles involving data, logic, or structured problem-solving. Like cognitive readiness, scores are adjusted for contextual friction to avoid over-indexing on privilege.
- Massachusetts Institute of Technology
- Georgetown University
- Georgia Institute of Technology
- United States Merchant Marine Academy
- University of Florida
- Florida Polytechnic University
- Purdue University
- University of Florida
- Duke University
- University of Georgia
Traits in Action
Just as the context of someone's education can offer more accurate insights into their potential, so too should the context of the hiring organisation be considered. A software engineer at a startup isn’t necessarily the same kind of hire as a software engineer at a large corporation.
At a fast moving-startup, engineers often work with limited structure and shifting priorities. They’re coding from scratch, adapting to change, and contributing across various functions of the company. Traits like quantitative reasoning matter, but so do self-direction, adaptability, and a growth mindset. You might find a candidate like this at schools such as Franklin W. Olin College of Engineering, University of Florida, or Florida Polytechnic University.
Now consider a technical role at a large insurance company. The engineer is joining a well-established organisation with legacy systems and defined processes. Much of the work involves maintaining infrastructure, formal communication across departments, and operating within possibly rigid hierarchies. In this context, conscientiousness and communication (as well as quantitative reasoning) are likely to contribute to success in the role. A candidate from institutions like California Institute of Technology, MIT, or Georgetown University might be a good fit.
Neither environment is “harder,” but they require different qualities to be productive and effective. That’s the point: Instead of defaulting to the same schools or proxies for every role, employers could start by identifying the traits that matter most for their context and build the search around that.
It’s interesting to see how these show up differently depending on the context applied to the same base weighting of quantitative reasoning.
You can have a go here.
Conclusion
Better data could take this further. While this framework focuses on degrees because that’s where clean, structured data exists, it could extend to bootcamps, certificates, or on-the-job training. These alternative pathways often produce talent that remains illegible to employers. With better metadata about courses6, especially from international sources, we could build a more global, inclusive model for evaluating talent.
This project is a starting point. It focuses on institutional data because that’s where standardised data exists, not because the institution itself is the signal. The deeper insight lies in the interaction between individuals and systems, and in the traits revealed when people succeed despite obstacles.
The goal isn’t to replace one list with another, but to challenge the concept of these lists and reinterpret their logic to build more human-centric systems.
Limitations and Interpretation
The data used in this framework comes from federal datasets that provide institution-level information, which means the patterns apply to institutions, not individuals. The findings point to environments where certain traits may be more likely to show up but don’t identify who has those traits. Individuals navigate complexity in all sorts of environments, not just institutions, and may have developed or exercised any of these traits elsewhere.
There are important gaps in the data. Because not all institutions are required to submit the same information, some variables are inconsistently reported, and others are missing entirely. For example, test score data is optional for many public systems. Several major public universities, including those in the University of California (UC) system, don’t report it to IPEDS. To address this, I manually added 2019 data from the UC system websites for schools where it was available. Even so, inconsistencies remain, and some institutions are excluded from lists that rely on missing data despite belonging in those comparisons.
The data is also limited in how it captures student subgroups. Fields like graduation rates or transfer outcomes aren’t disaggregated by race, age, income, or first-generation status at a level that allows for more accurate interpretation. This makes it harder to understand how different students experience the same environment and limits the ability to account for structural inequality in outcomes.
Most importantly, context is always shaped by what the data can and cannot show. Institutional design e.g. course availability, advising models, financial support, affects graduation rates and outcomes. Those factors aren’t captured directly, which means the same outcome can reflect very different levels of support depending on the institution.
This framework is meant to highlight patterns and prompt reflection, not create a new system for labelling people. It can help surface traits that are otherwise overlooked, but it should never be used to reduce someone to their college. The goal is to ask better questions, not draw more hard lines.
Of course, the irony is that this framework draws its foundation from variation in institutional support. That reflects the data we have–it’s not a suggestion that institutions should manufacture hardship to help students “prove themselves.” The goal is to better understand the traits individuals exhibit over time. Hiring processes focus heavily on outcomes and rarely consider the full picture, yet consistency of performance over time matters. In this dataset, traits become visible through friction. Ideally, these same traits would be surfaced through intentional design, not by default.
What matters isn’t the college. It’s what the student did within it.
A more technical breakdown of the thought process behind the formulas used to derive these traits are available at the end.
Data Exclusions
The dataset was filtered to include only institutions that primarily grant bachelor’s degrees, since the goal was to interpret traits from completed undergraduate credentials. Colleges with fewer than 400 undergraduate students were excluded to reduce noise from small sample sizes. Institutions that were overly specialised, such as seminaries or health sciences colleges, were also removed. These often serve students on narrowly defined professional tracks, which limits the variability in educational paths the framework is designed to surface. However, institutions specialising in fields like art, design, engineering, or business were retained. While these schools have a clear disciplinary focus, their graduates tend to pursue broader and more varied career paths, making their inclusion relevant to the kinds of traits and contexts the tool aims to reflect.
Reflection
This project began as an essay exploring trait signalling and how U.S. News applies IPEDS data to generate their rankings. I wanted to explore how combining these ideas could work in practice.
The first version of the technical framework focused on the traits highlighted by the “sheepskin effect”--conscientiousness and cognitive readiness. I drafted formulas using available IPEDS data on graduation rates and test scores to infer these signals, initially intending to use them as examples in the essay. Then I recognised that it probably wouldn’t be too difficult to actually try it out. Applying my theoretical formulas to the data led to the following iterations:
The first iteration of the formulas weren’t really formulas, just variables taken in isolation:
conscientiousness = 4-year graduation rate
Though conscientiousness and cognitive readiness are useful traits, I decided it would be interesting to see what other in-demand traits I could infer using formulas from the same dataset. I used ETS’s “Top-rated skills based on employer surveys and analysis of job ads” to identify additional traits worth exploring: resilience/grit, adaptability, self direction, growth mindset, communication, and quantitative reasoning.
I quickly realised that it didn’t make sense to measure traits in isolation from friction or disadvantage, so I built a second layer that attempted to account for this. At first, I applied the same friction adjustment across traits using a simple formula:
friction = (1 - % of non-Pell recipients)
But it soon became clear that the sources of friction vary by trait. For example, a delayed graduation might indicate resilience, while timely graduation in a low-support environment might signal conscientiousness. Applying the same friction formula to every trait wouldn’t reflect this. So instead of layering on context afterward, I embedded it directly into each formula so that each trait would have its own relevant friction points baked in:
conscientiousness = (4-year graduation rate x % of students not awarded Pell Grant) x 6-year graduation rate for Pell recipients x % of students awarded Pell Grant)
These scores reflected traits across the entire student population, but I changed my approach after recognising that most people evaluating a credential are likely dealing with someone who graduated. Including non-completers diluted that signal, so I restructured the formulas to reflect only graduates, using completion rates as both a filter and a variable.
I shifted the question from “how much of this trait exists at this school?” to “what proportion of graduates from this school might exhibit this trait?” Since the goal to interpret what a credential from that institution might reasonably imply about the person holding it (not to evaluate institutions,) it made sense to alter the question to reflect only graduates. Thus the formula evolved into its final state:
conscientiousness = (% of students awarded Pell Grant × ((4-year graduation rate for Pell recipients + 6-year graduation rate for Pell recipients + 8-year graduation rate for Pell recipients) / 3)) + (% of students not awarded Pell Grant × ((4-year graduation rate for non-Pell recipients + 6-year graduation rate for non-Pell recipients + 8-year graduation rate for non-Pell recipients) / 3))
I included the average of the 4, 6, and 8-year graduation rates to focus on the behaviour of students who completed their degrees rather the entire entering cohort. It also accounts for additional institutional friction that Pell status alone doesn’t capture, recognising that extended timelines can still reflect conscientiousness in lower-support environments where graduating at all may require significant self-management.
In applying friction adjustments like Pell Grant percentages across multiple formulas, I noticed a slight compounding effect. When multiple traits adjusted using the same friction variable are selected, schools with that characteristic may score higher in the results, even if the variable was only meant to add context to a specific trait. If someone knows how to fix this, I’d love to hear from you.
Ultimately, this whole thing was meant to be an essay and I feel like I’ve already drifted pretty far from my technical scope. It would likely take someone with formal training in data analytics to rectify these potentially significant shortcomings.
The weightings applied to the formulas are subjective. They’re based on intuition and iterated to pass my own (bias!) basic sense check. That part of the process can’t be fully reasoned and I want to clearly acknowledge the structural implications of this. I have a general sense of the factors that create friction in a student’s path, but the weightings don’t reflect a formal or data-driven approach to prioritising them. It’s very likely that we would make those decisions differently, and a working group of individuals with various perspectives might be the best mitigator.
This framework uses averages and weighted percentages to estimate the prevalence of traits. While useful for surfacing broad patterns, these methods may obscure non-linear dynamics or cohort-specific effects. Some traits might manifest more strongly under particular conditions that aren’t fully captured when aggregating across entire institutions.
This project could benefit from more formal methods like regression analyses or correlation matrices, particularly to test relationships between variables or better isolate causal effects. For now, it remains an exploratory tool meant to raise questions rather than answer them conclusively.
Help Improve This Work
This is an ongoing attempt to interpret credential data more meaningfully. It's limited by the structure and availability of public data, especially from nontraditional institutions.
If you work at a college and have access to disaggregated outcomes e.g. by age, modality, first-gen status, or advising access, I’d love to hear from you.
I’m also looking for collaborators with experience in data cleaning, education systems, or statistical modelling. I’ve built tools to parse IPEDS data, but I’m not a statistician. There’s still a lot of signal left to uncover.
If you’d like to contribute, share feedback, or point me to data that might help, I’d love to hear from you. arina.berezovsky@gmail.com :)
Formulas
Each trait estimate reflects the percentage of graduates from a given institution who likely demonstrated that trait. The calculations are based on institutional data from IPEDS. Where relevant, formulas incorporate contextual factors like percentage of students awarded Pell Grant funding, to better reflect the friction or structural constraints students may have navigated.
Missing or suppressed data (e.g. test scores not submitted) results in a trait score of “Unavailable” for that institution. The traits database and front-end code are publicly available on GitHub. The formulas for calculating traits are presented below:
Conscientiousness
(% of students awarded Pell Grant × ((4-year graduation rate for Pell recipients + 6-year graduation rate for Pell recipients + 8-year graduation rate for Pell recipients) / 3)) + (% of students not awarded Pell Grant × ((4-year graduation rate for non-Pell recipients + 6-year graduation rate for non-Pell recipients + 8-year graduation rate for non-Pell recipients) / 3))
Resilience/Grit
0.3 × ((% of students awarded Pell Grant × ((6-year graduation rate for Pell recipients − 4-year graduation rate for Pell recipients) + (8-year graduation rate for Pell recipients − 6-year graduation rate for Pell recipients))) + (% of students not awarded Pell Grant × ((6-year graduation rate for non-Pell recipients − 4-year graduation rate for non-Pell recipients) + (8-year graduation rate for non-Pell recipients − 6-year graduation rate for non-Pell recipients)))) + 0.25 × (transfer-in undergraduate enrolment / total undergraduate enrolment × 100) + 0.25 × (undergraduate enrolment aged 25 or over / total undergraduate enrolment × 100) + 0.2 × (GI Bill recipients / total undergraduate enrolment × 100)
Adaptability
0.25 × (transfer-in undergraduate enrolment / total undergraduate enrolment × 100) + 0.25 × (degree-seeking students enrolled fully online / total undergraduate enrolment × 100) + 0.2 × (degree-seeking students enrolled in hybrid formats / total undergraduate enrolment × 100) + 0.2 × (undergraduate enrolment aged 25 or over / total undergraduate enrolment × 100) + 0.1 × (GI Bill recipients / total undergraduate enrolment × 100)
Self Direction
0.25 × (undergraduate enrolment aged 25 or over / total undergraduate enrolment × 100) + 0.25 × (part-time undergraduate enrolment / total undergraduate enrolment × 100) + 0.25 × (degree-seeking students enrolled in hybrid formats / total undergraduate enrolment × 100) + 0.25 × (((6-year graduation rate + 8-year graduation rate) / 2) × 4-year graduation rate / 100)
Growth Mindset
0.4 × (degree-seeking students enrolled in hybrid formats / total degree-seeking students in all modalities × 100) + 0.3 × ((% of students awarded Pell Grant × (6-year graduation rate for Pell recipients − 4-year graduation rate for Pell recipients)) + (% of students not awarded Pell Grant × (6-year graduation rate for non-Pell recipients − 4-year graduation rate for non-Pell recipients))) + 0.3 × ((% of students awarded Pell Grant × (8-year graduation rate for Pell recipients − 6-year graduation rate for Pell recipients)) + (% of students not awarded Pell Grant × (8-year graduation rate for non-Pell recipients − 6-year graduation rate for non-Pell recipients)))
Cognitive readiness
SAT/ACT composite score × (1 − % of students awarded Pell Grant)
Communication
0.5 × (English test score × (1 − % of students awarded Pell Grant)) + 0.3 × ((% of students awarded Pell Grant × 6-year graduation rate for Pell recipients) + (% of students not awarded Pell Grant × 4-year graduation rate for non-Pell recipients)) + 0.2 × (U.S. non-resident undergraduate enrolment / total undergraduate enrolment × 100 × control multiplier)
Control multiplier = 1.0 (public), 0.75 (private non-profit), 0.5 (private for-profit)
Quantitative Reasoning
Math SAT/ACT score × (1 − % of students awarded Pell Grant)
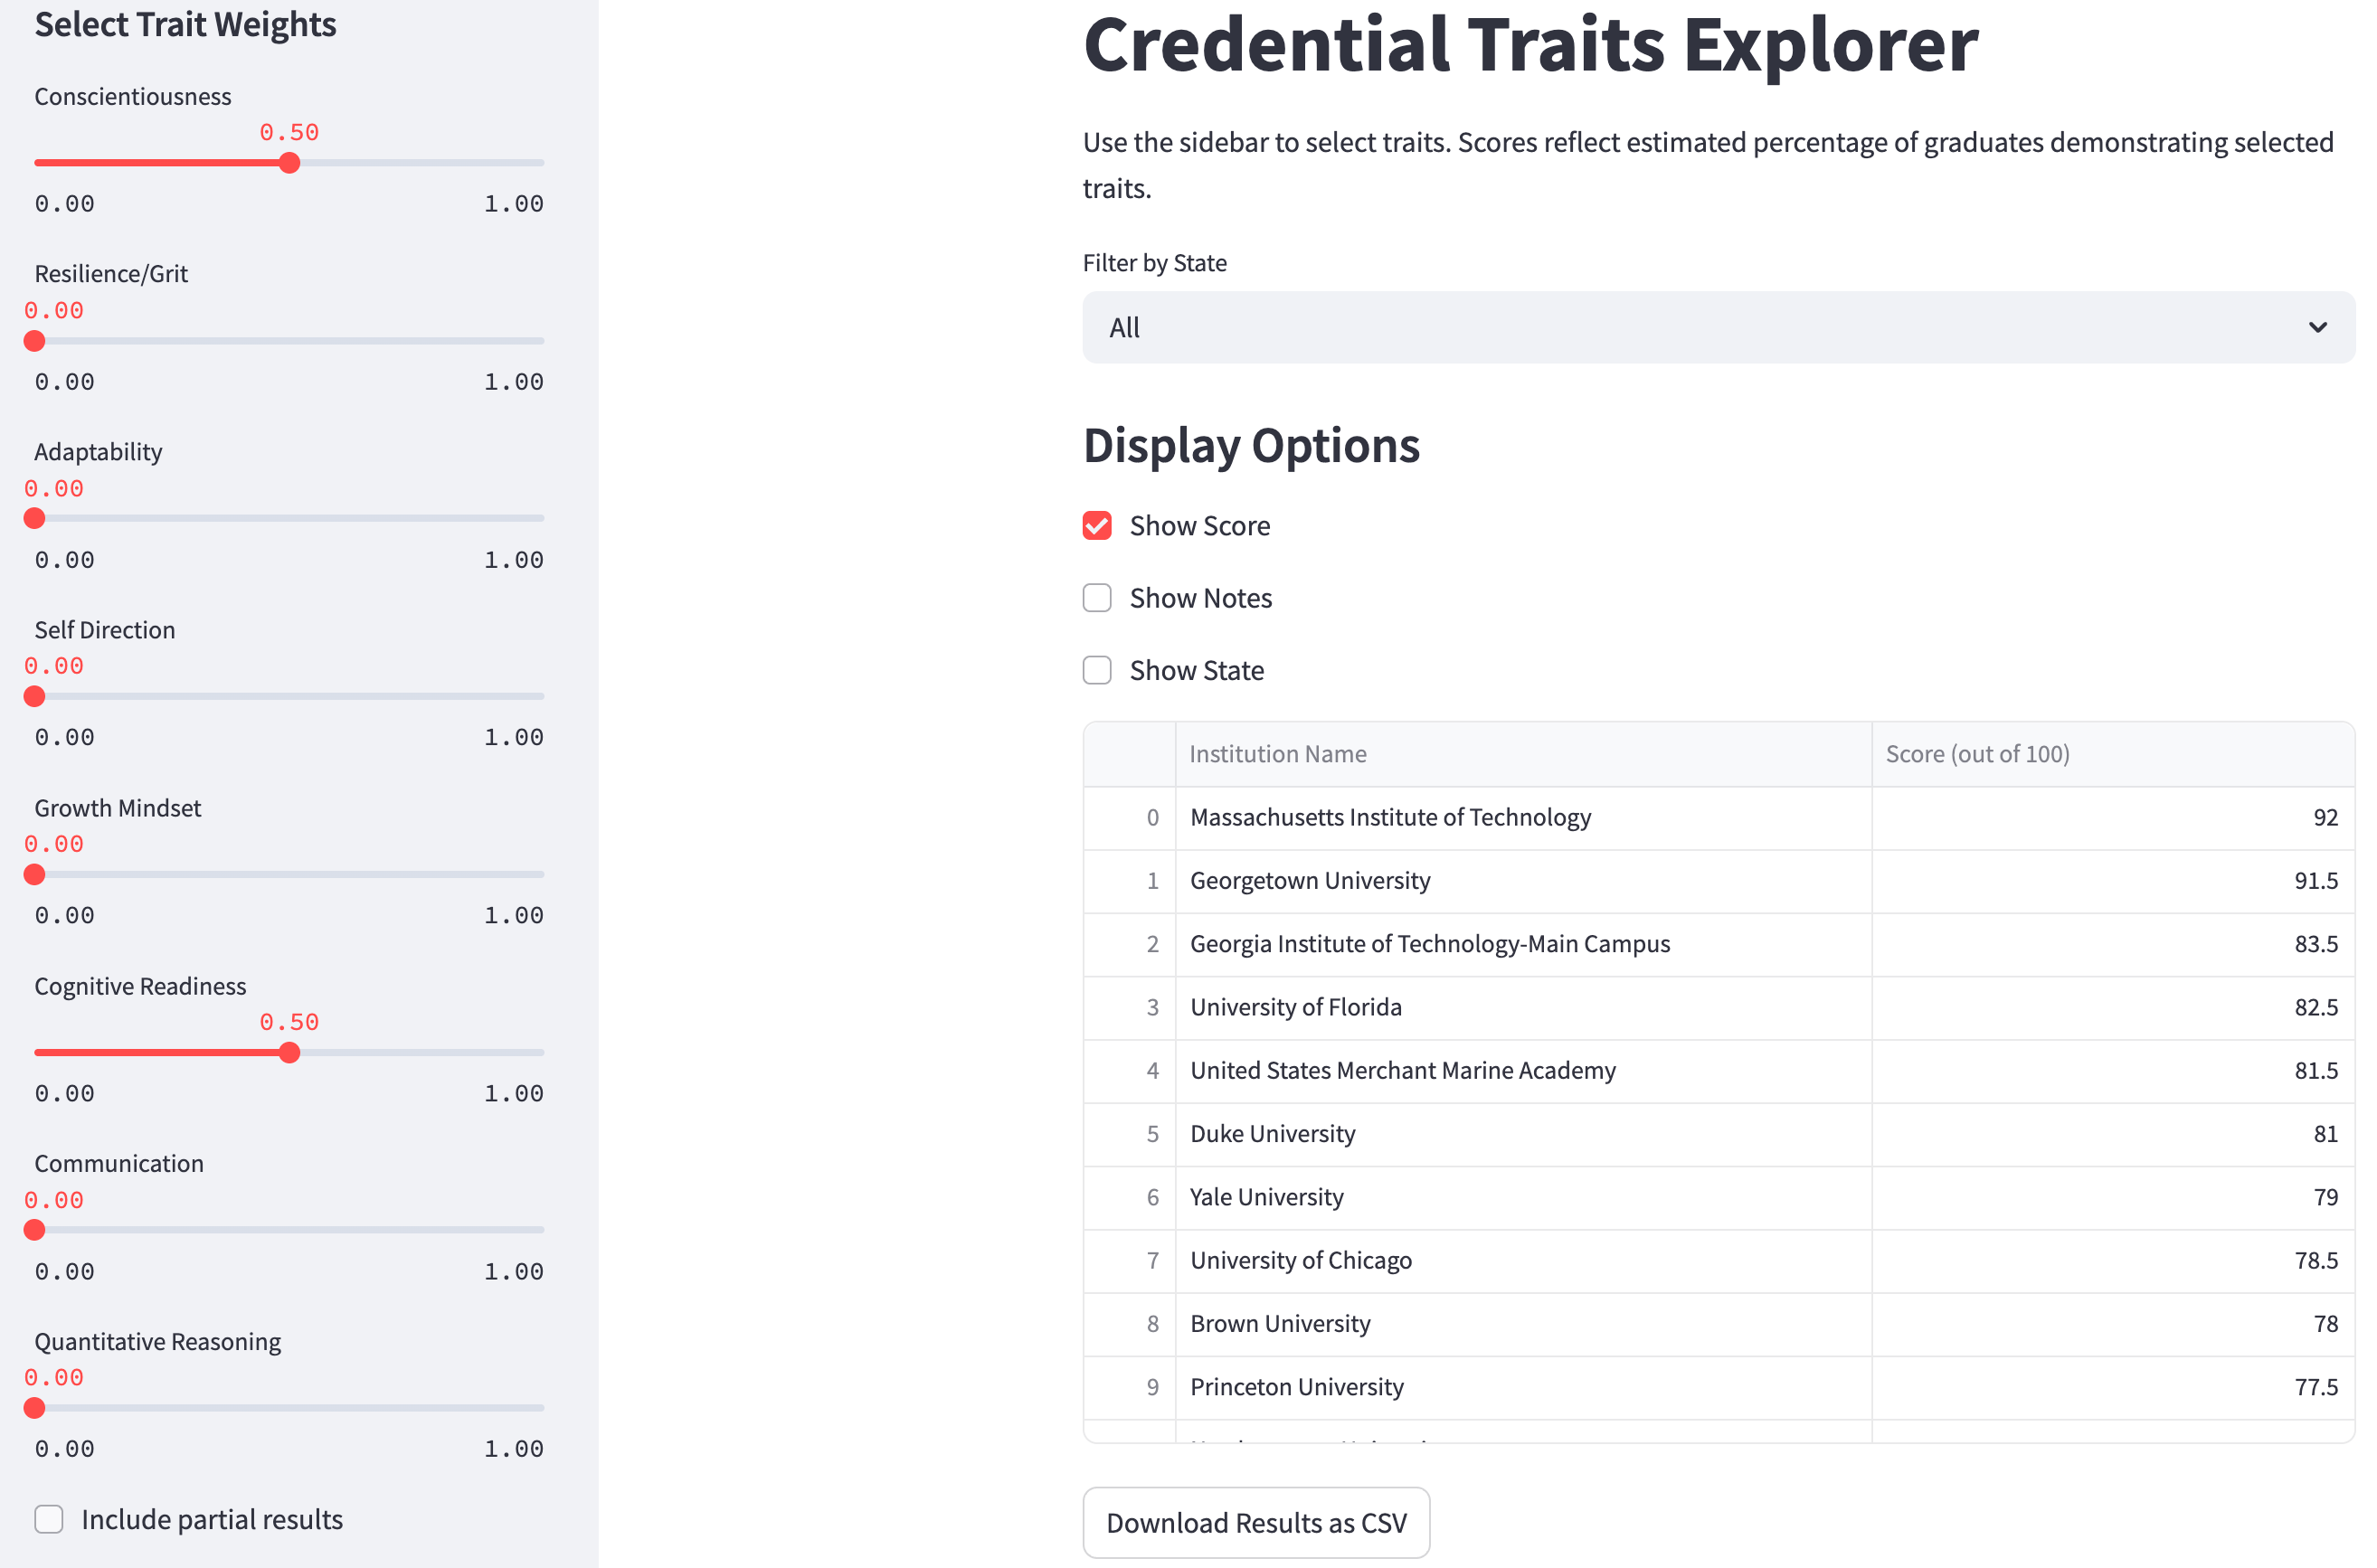
Tool/Technical Implementation
To make the framework interactive, I built a simple front-end using Streamlit. The tool lets users adjust the weightings of different traits, filter by state, and choose whether to include institutions with partial data. Trait scores are normalised based on the selected weights and institutions missing relevant data for those traits are either excluded or flagged depending on the setting. While the underlying logic mirrors the Excel formulas, the app allows for easier exploration and comparison of institutional signals across different trait combinations.
Next Steps
While the formulas are designed to isolate specific traits, they don’t yet explore how traits might cluster or interact within individuals. In reality, traits like adaptability and resilience often appear together, especially in complex educational paths. Future iterations could look at these combinations and explore which clusters align with success in different job contexts.
There are more directions to explore. While this version focuses on graduates, a natural next step would be to develop complementary formulas that help identify traits among non-graduates (the Some College No Degree population). Their paths might surface different strengths that don’t appear in traditional rankings but are still valuable in the workplace. Analysing this group on its own terms could offer useful insight into a workforce segment that’s often overlooked (and growing.)
This project started in response to the U.S. News rankings, but the focus here is to apply that data differently. It leans toward evaluating credentials from an employer’s point of view, but there’s also room to rethink how students interpret credentials when choosing where to apply or enrol.
Another area worth exploring is the resume itself. Most parsing tools today flag gaps or look for specific keywords. But it would be more interesting to see whether certain patterns in someone’s path might reveal traits, rather than using these tools to screen people out.
Data Source + Thanks
All institutional data is drawn from the Integrated Postsecondary Education Data System (IPEDS), a publicly available dataset maintained by the National Center for Education Statistics (NCES). I’m grateful for their work in making educational data transparent and accessible.
Notes
[1] Usually extracted using resume parsing tools.
[2] There are also assessments, but I’m more interested in approaches that don’t contribute to candidate burnout by requiring additional effort on their part.
[3] When employers complain that recent graduates are unprepared for the workplace, the fault often lies less with the students than with the system. Since the 1970s, as college attendance expanded (boosted by policies like the Pell Grant), employers increasingly treated degrees as proxies for job readiness. Over time this contributed to a gradual decline in employer-funded/in-house training programs. With more candidates arriving with formal credentials companies had less incentive to invest in developing entry-level talent themselves.[a]
Despite playing a limited role in shaping curricula, employers still expect graduates to be work-ready. This disconnect helps explain why many colleges have come to resemble de facto training centres for white-collar roles. The accelerating pace of technological change has only made the gap more visible. When technical skills played a smaller role and technology evolved more slowly, the gap between what was taught and what was needed was easier to ignore. Today, as workplace-specific competencies increasingly influence performance, the consequences of this lack of coordination are harder to overlook.[b]
[4] “On time” here means within 4-years.
[5] The sheepskin effect theory of signalling, based on test scores and degree completion, offers one way to interpret this dynamic. But it doesn’t account for important factors like socioeconomic background, institutional support, or access to information, which shape who completes a degree and under what conditions. However, it still captures something worth noting: completion signals certain traits, and employers respond to that signal.
References
[a] Dougherty, K. J. (1994). The contradictory college: The conflicting origins, impacts, and futures of the community college. SUNY Press.
[b] Fuller, J. B., Raman, M., Sage-Gavin, E., & Hines, K. (2021). Hidden workers: Untapped talent – How leaders can improve hiring practices to uncover missed talent pools, close skills gaps, and improve diversity. Harvard Business School Project on Managing the Future of Work. https://www.hbs.edu/managing-the-future-of-work/Documents/hiddenworkers090321.pdf
[c] Rivera, L. A., & Tilcsik, A. (2016). Class Advantage, Commitment Penalty: The Gendered Effect of Social Class Signals in an Elite Labor Market. American Sociological Review, 81(6), 1097–1131.
[d] Binder, M., Krause, K., & Cerna, L. (2015). The Value of a Degree: Evidence from Field Experiments on the Labor Market for Young Professionals. Education Economics, 23(5), 597–610.
[e] Caplan, B. (2018). The Case Against Education: Why the Education System Is a Waste of Time and Money. Princeton University Press.
[f] U.S. News ranking methodology: https://www.usnews.com/education/best-colleges/articles/ranking-criteria-and-weights
[g] Traits included in this piece come from “Top-rated skills based on employer surveys and analyses of job ads (Table 8) from: Kyllonen, P. C., Sevak, A., Ober, T., Choi, I., Sparks, J., & Fishtein, D. (2024). Charting the future of assessments. ETS Research Institute. https://www.ets.org/research/policy_research_reports/publications/report/2024/khdt.html